Participate in the 2025 SOD Blitz!
May 9 - June 15
**REGISTER HERE**
register no later than Friday, June 6th to receive packets by mail
*Este es un evento bilingüe* Preguntas: Comuníquese con la Coordinadora del Programa de Muerte Súbita del Roble, Kerry kwininger@ucanr.edu
Brought to you by UC Berkeley Forest Pathology and Mycology Laboratory and UCCE Sonoma.
--------------------------------------------------------------------------------------------------
SOD Blitz Results Meetings 2024
2024 Online Webinar Meeting
Zoom Webinar Meeting – Tuesday 11/19/24 5-7pm – Abbreviated discussion focusing on the blitz results. Please register(above) for the online meeting and we will email you the Zoom link.
Save the data for these meetings with Matteo, the SOD Blitz organizers, and our lab!
Please forward this registration information to anyone who would be interested in the webinar.
2024 In-Person Meetings
Woodside – Tuesday 11/12/24 6-8pm – Woodside Town Hall, 2955 Woodside Rd, Woodside, CA
In-depth discussion on distribution of 2024 SOD outbreaks, management options, and time for questions. We will have specific information for peninsula residents about new findings in their communities. Please register (above) if you plan to attend this in-person meeting.
Sonoma – Wednesday 12/11/24 6-8pm – UCCE Extension Office, 133 Aviation Blvd #109, Santa Rosa, CA
In-depth discussion on distribution of 2024 SOD outbreaks, management options, and time for questions. Please register (above) if you plan to attend this in-person meeting.
--------------------------------------------------------------------------------------------------
2023 SOD BLITZ RESULTS
Over 10,000 trees across the state were surveyed in 2023. SOD incidence increased in some parts of Sonoma County from 2022, while some areas of the southern Mendocino coast and Anderson Valley experienced outbreaks in areas where SOD was previously detected. See the full table of SOD Blitz Results here.
| Surveyed Trees | Symptomatic Oak Nearby | Sampled Trees | SOD Positive Sampled Trees | Estimated True Infection Rate | Symptomatic Trees Surveyed | |
| Mendocino | 266 | 3% | 67 | 1.5% | 0.3% | 21.2% |
| Sonoma-West | 541 | 6.1% | 114 | 3.5% | 1.8% | 52.6% |
| Sonoma-North | 44 | 6.7% | 15 | 6.7% | 2.8% | 42.6% |
| Sonoma-East | 762 | 0.9% | 134 | 13.4% | 5.4% | 40.1% |
--------------------------------------------------------------------------------------------------
Video: SOD in Sonoma County
--------------------------------------------------------------------------------------------------
SOD Program Posters
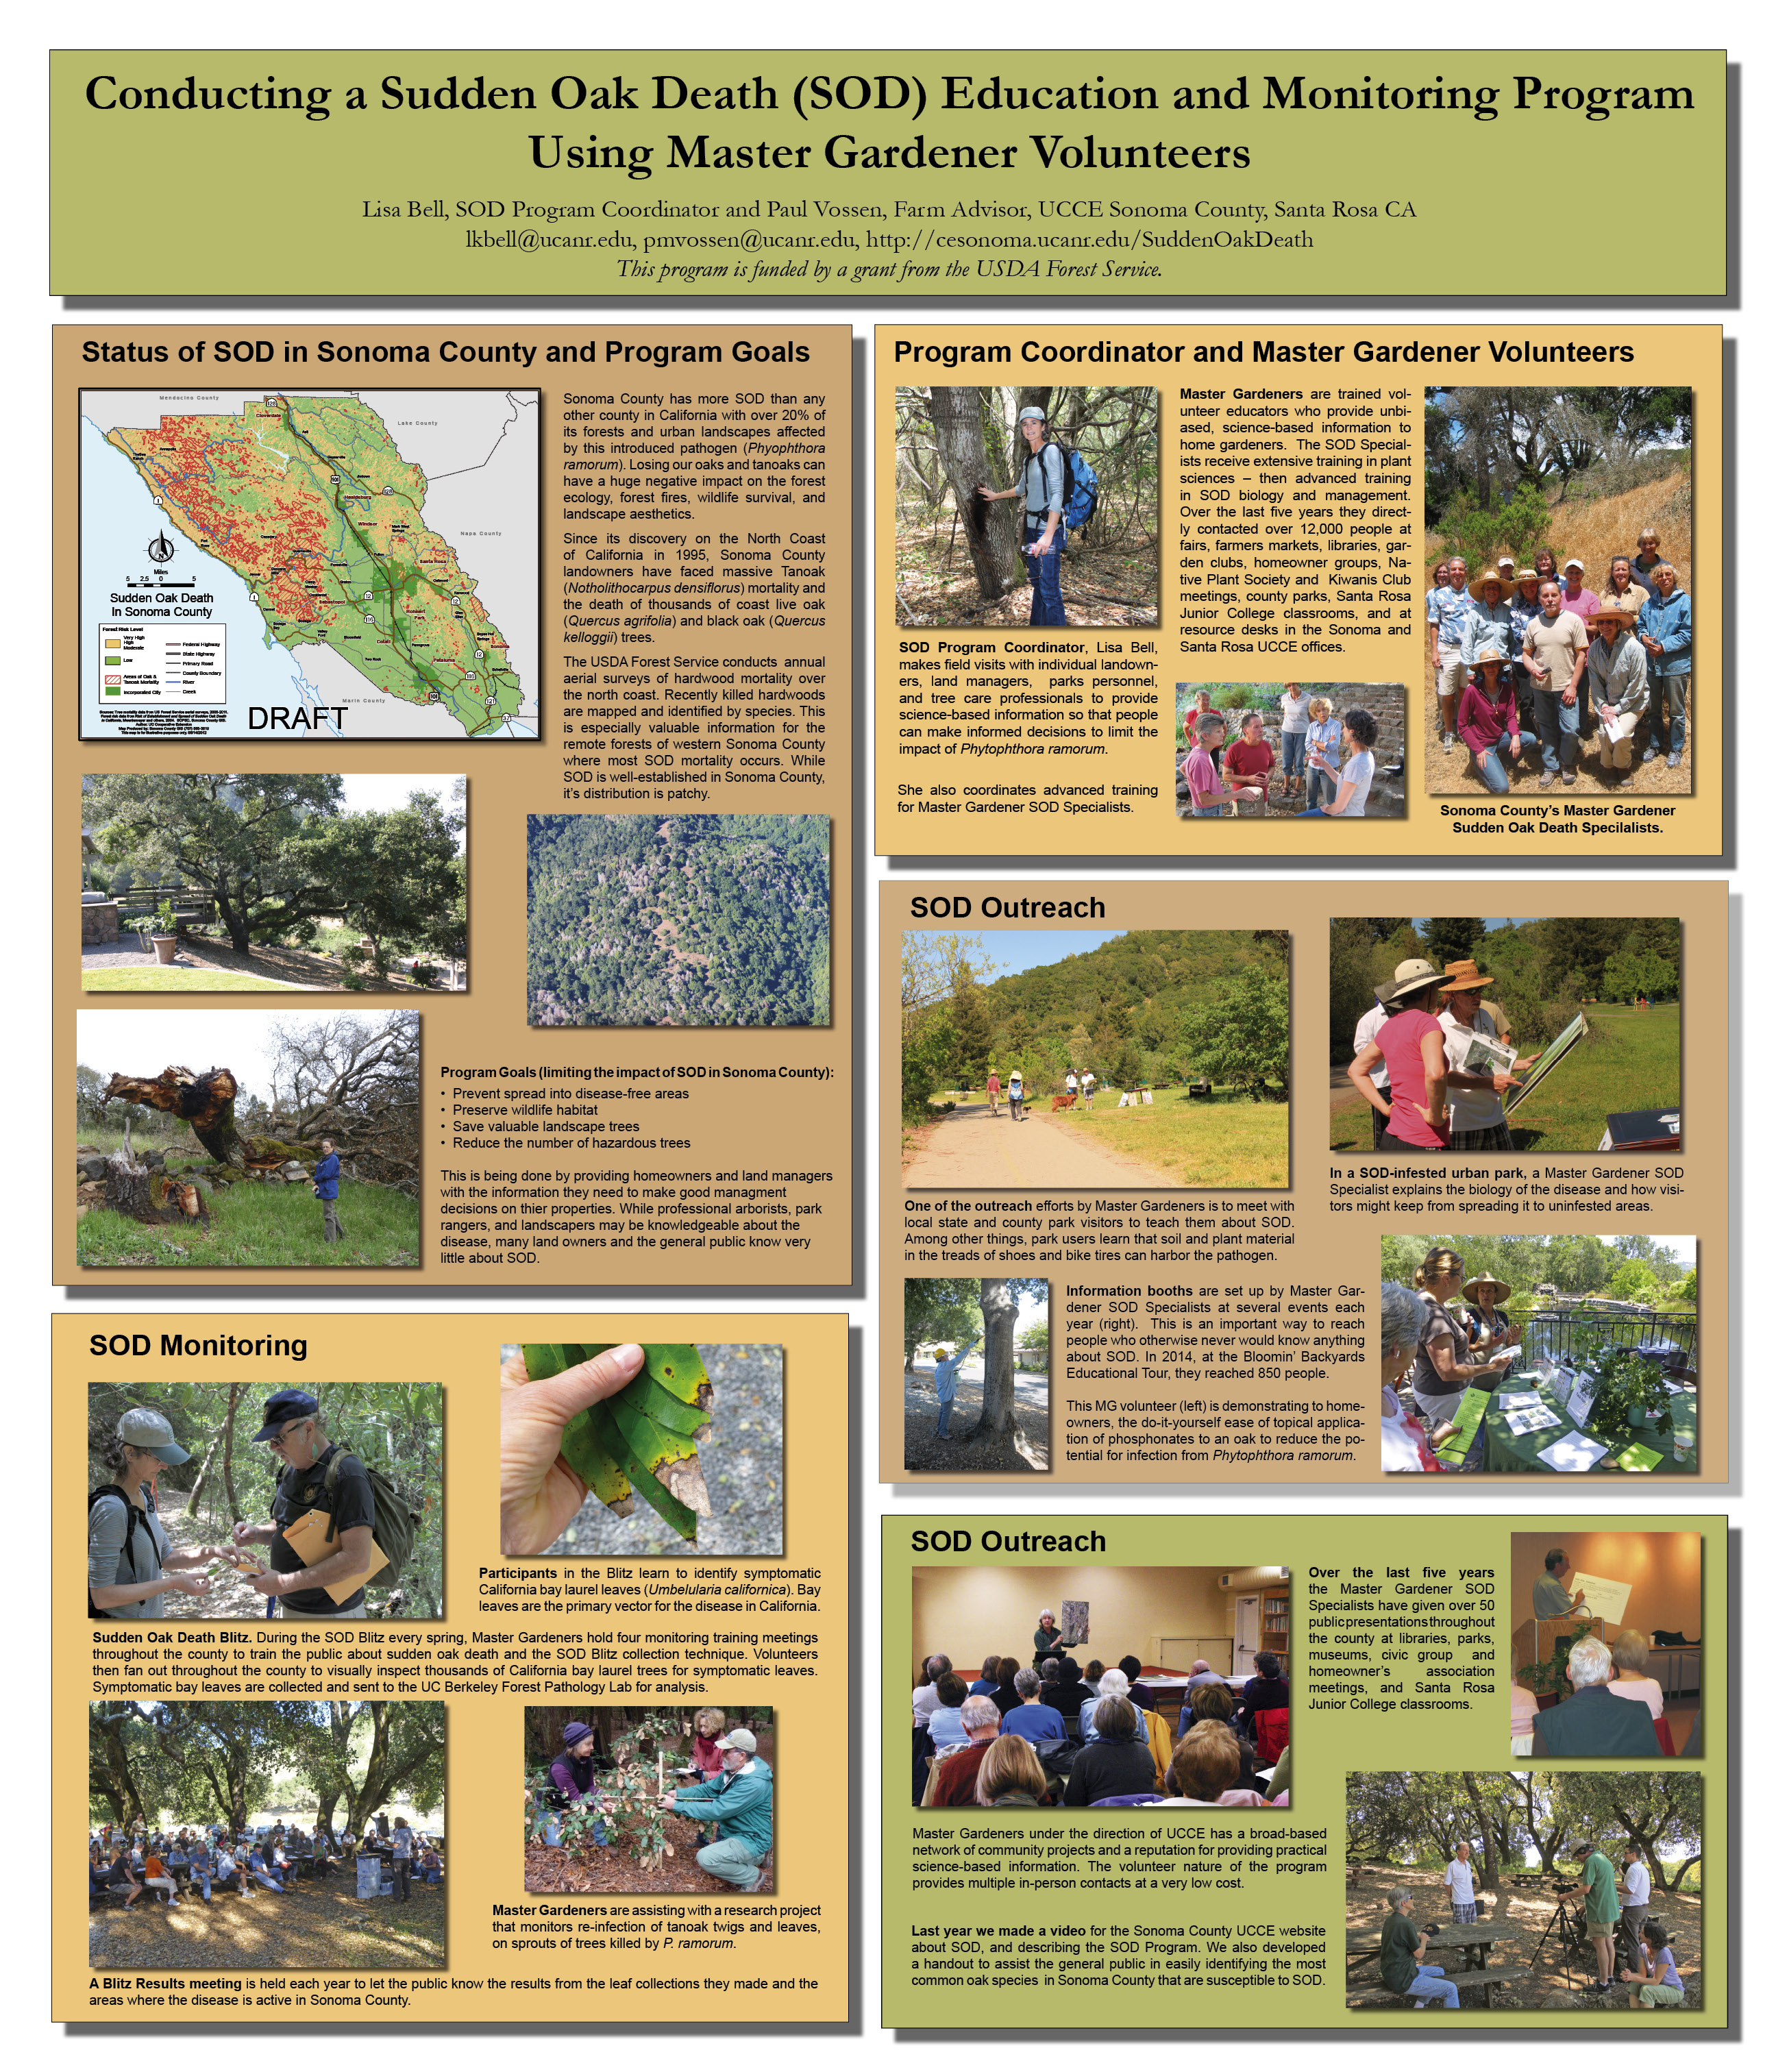
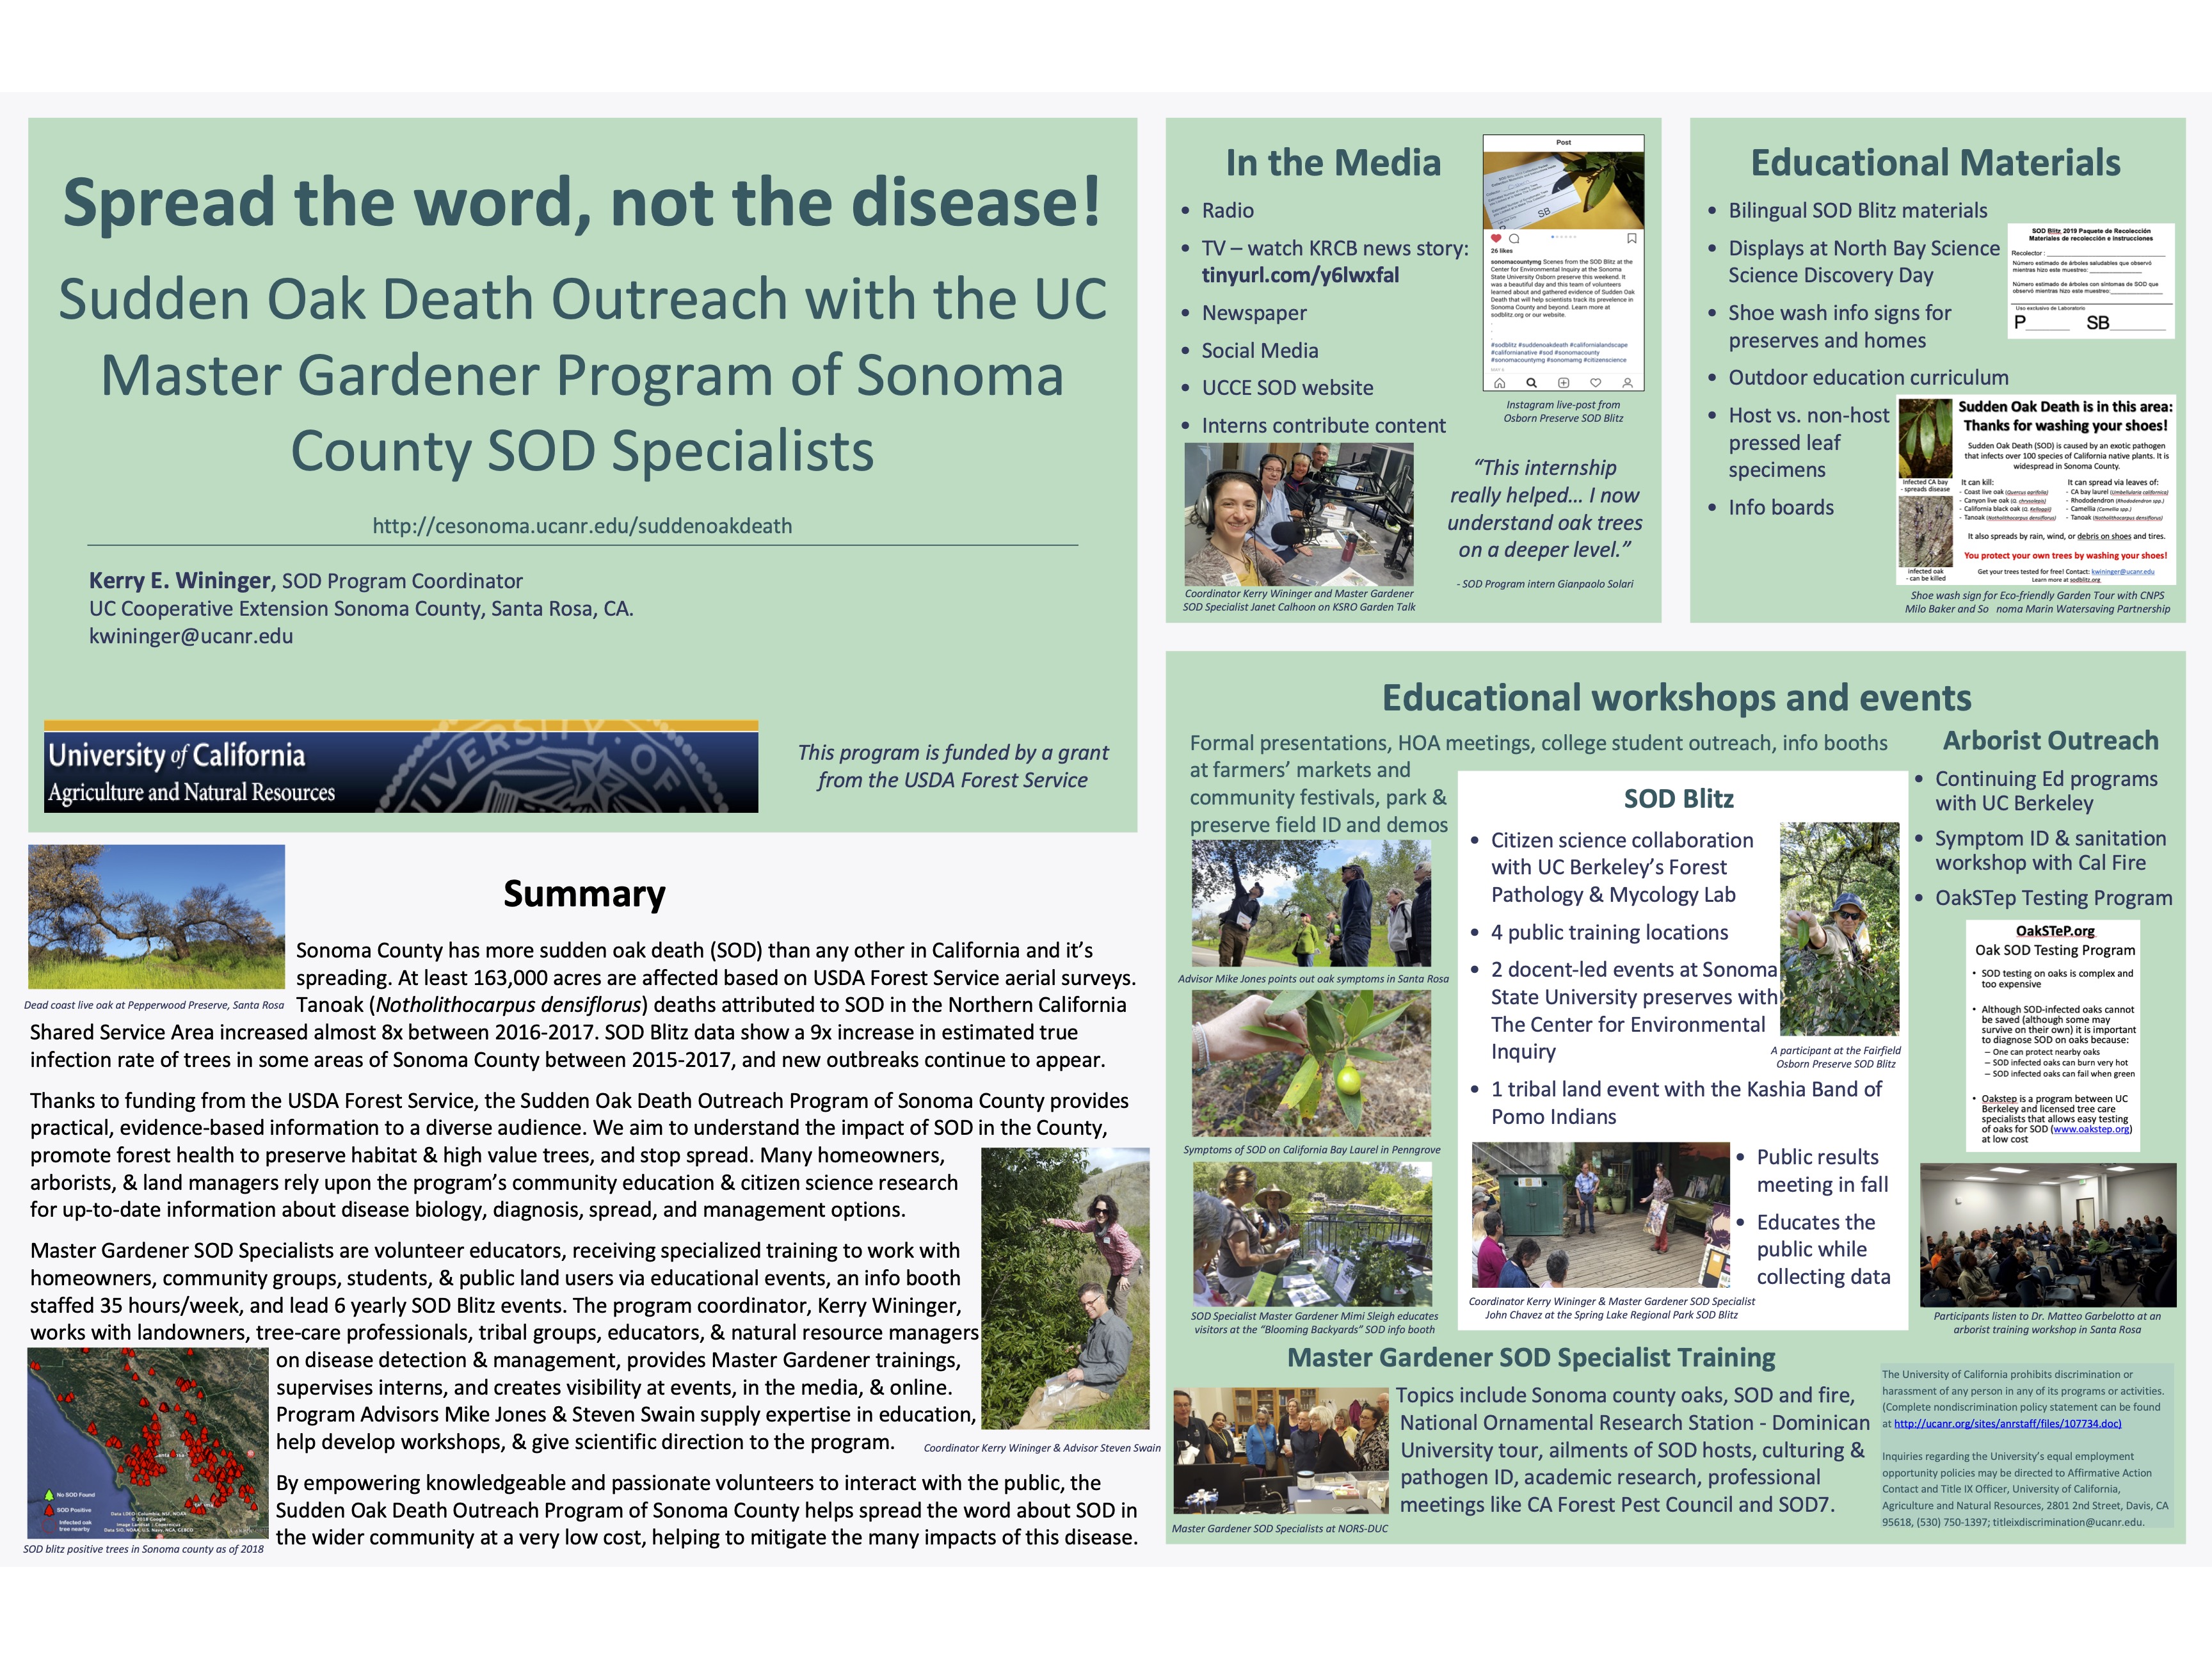
Click on images to enlarge
--------------------------------------------------------------------------------------------------
SOD Results Map 2023
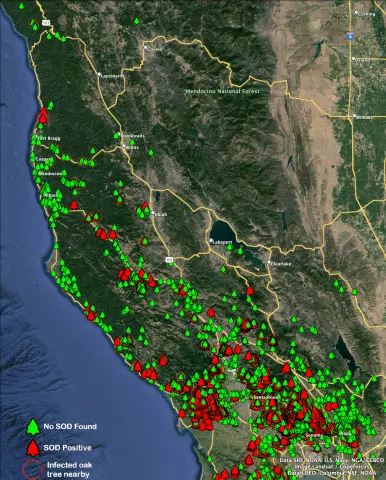
Full SOD Blitz Google Earth Map Overlay available here