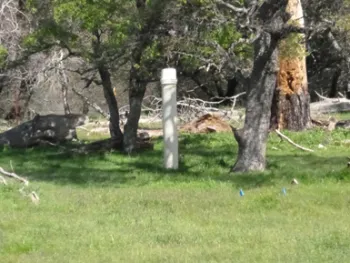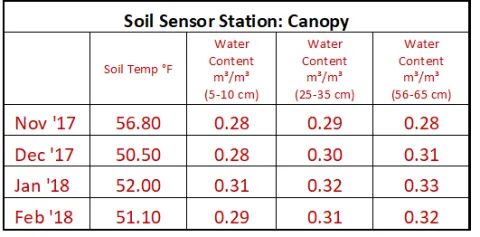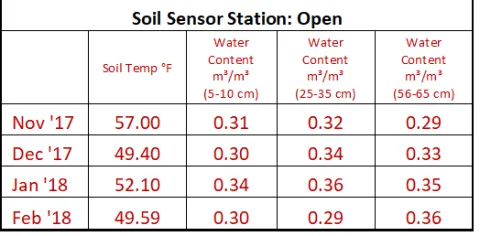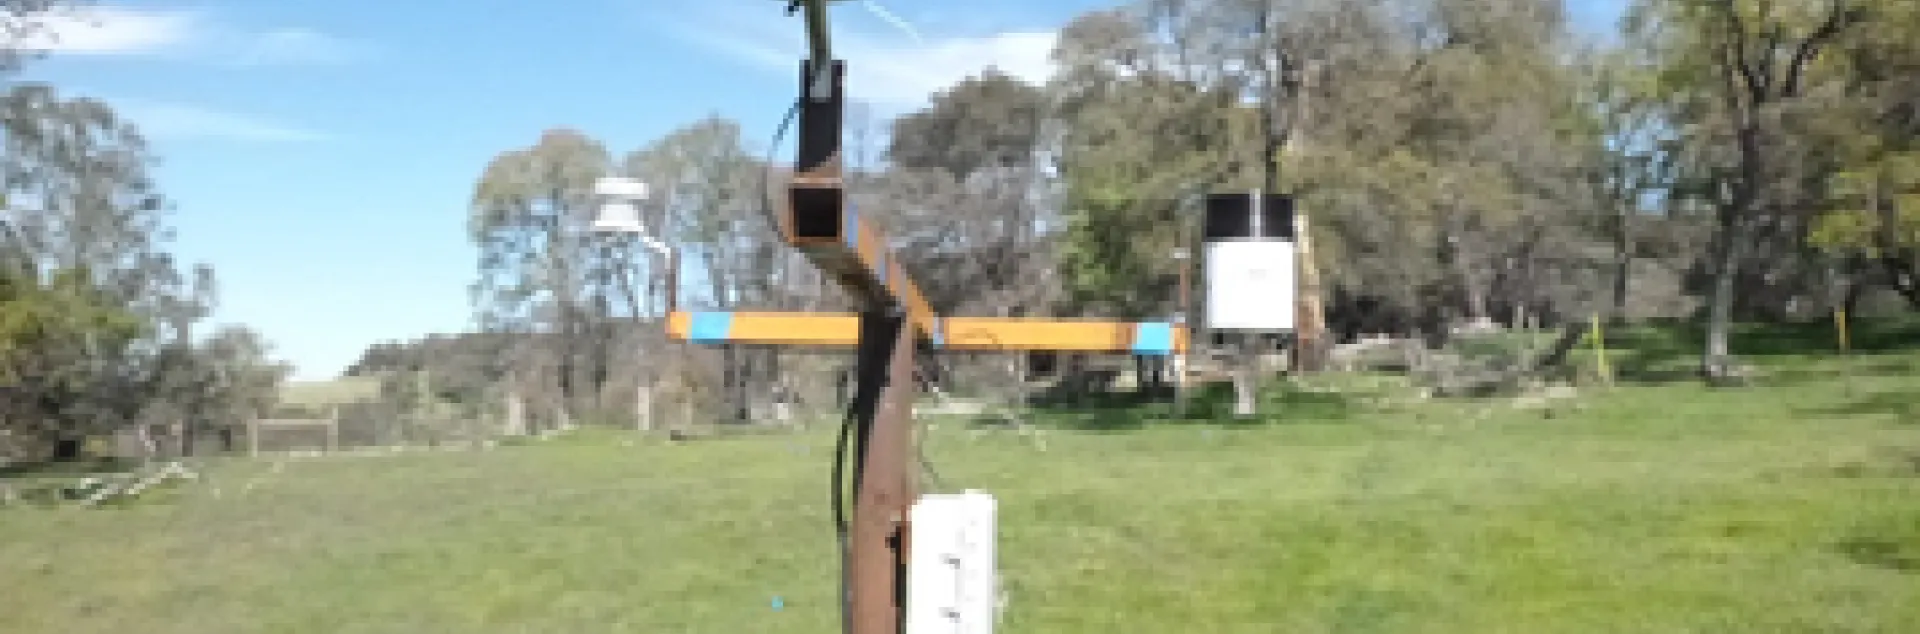
Sierra Foothill REC has been collecting and recording rangeland forage production data since 1979. Every year when rangeland forage production values are recorded, explanations as to the results of pounds per acre grown are based on past forage production values & statistics, plus a CIMIS weather station which resides at 660' elevation; whereas, the Forage Plot lies at 1470' and 1.3 miles away from #084 Browns Valley CIMIS Station. SFREC has recently installed replicated soil temperature sensors (5-10 cm in depth), soil water content sensors (5-10 cm, 25-35 cm, & 56-65 cm in depth), air temperature sensors, and a precipitation gauge. Two replicated soil sensor stations were each placed under canopy and in the open. Illustrated below are tables and graphs depicting rangeland forage production values and trends, newly installed soil sensor data (Open and Canopy), and a dramatic comparison (Forage Plot vs. CIMIS) in precipitation values.
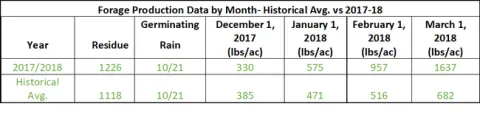
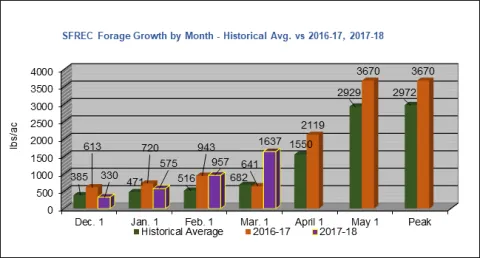
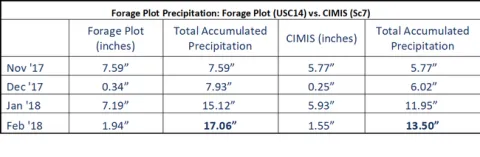
There were two major developments during this rangeland forage production season (Nov 1, 2017 thru March 1, 2018). The first being that we had the highest level of forage production for the month of February (1637 lbs/ac) in our recorded history. The warm February we had may be a contributing factor to this. The other major development is the significant differences in monthly/total precipitation values between the CIMIS and the forage plot.
If you have any comments, please leave your reply directly below.