The best soil P test for rice: Olsen-P vs Bray-P
This year, with high input costs and low rice prices, a lot of growers are testing their soil to determine if they need to apply P and K fertilizer. I have received a number of calls this week asking about interpreting their soil P test for rice soils. I have recommended using the Olsen-P test (or a sodium bicarbonate test) as it is a better predictor and more sensitive to available soil P levels for rice. Globally, it is also the most used test for rice (it may be a different for other crops). Most labs here in California use the Bray-P test as their default in their soil analysis. When sending in a soil sample, you usually have to ask for the Olsen-P test.
In previous meetings I have recommended the Olsen-P test based on research we have done here in California. Here, I want to show you why I recommend the Olsen-P test. Looking at the two graphs below (Figure 1) we compare Olsen-P to Bray-P and see how well they correlate with Y-leaf P concentration. This is data from 64 field trials where we took soil samples before planting and then Y-leaf samples around 35 days after planting. A Y-leaf P concentration of 0.3 at this stage is usually considered adequate.
Based on these graphs, the Olsen-P test is a better predictor of Y-leaf P concentration than Bray-P. First, you can see that the R2 is 0.44 for Olsen-P and only 0.13 for Bray-P (a higher R2 means it is better correlated). Second, you can see the Olsen-P data is much more spread out. In the Bray-P graph most of the soil P values are bunched in a narrow range - less than 10 ppm.

| 
|
Figure 1. Y leaf P (35 days after seeding) vs Olsen and Bray soil P tests.
Based partially on the graph above (Figure 1), but also on other data, a conservative Olsen-P value of 12 ppm or higher suggests that your soil is not deficient for P. For the Bray-P test there is a large cloud of data that makes it hard to determine the critical P level.
All that said, many of you may only have Bray-P soil data to work with. So, recognizing that the Bray-P is much less accurate (and this data needs to be taken with a lot of caution), I examined the correlation between Olsen-P and Bray-P (Figure 2). The figure below indicates that an Olsen-P of 12 ppm is equivalent to a Bray P of 5 ppm.
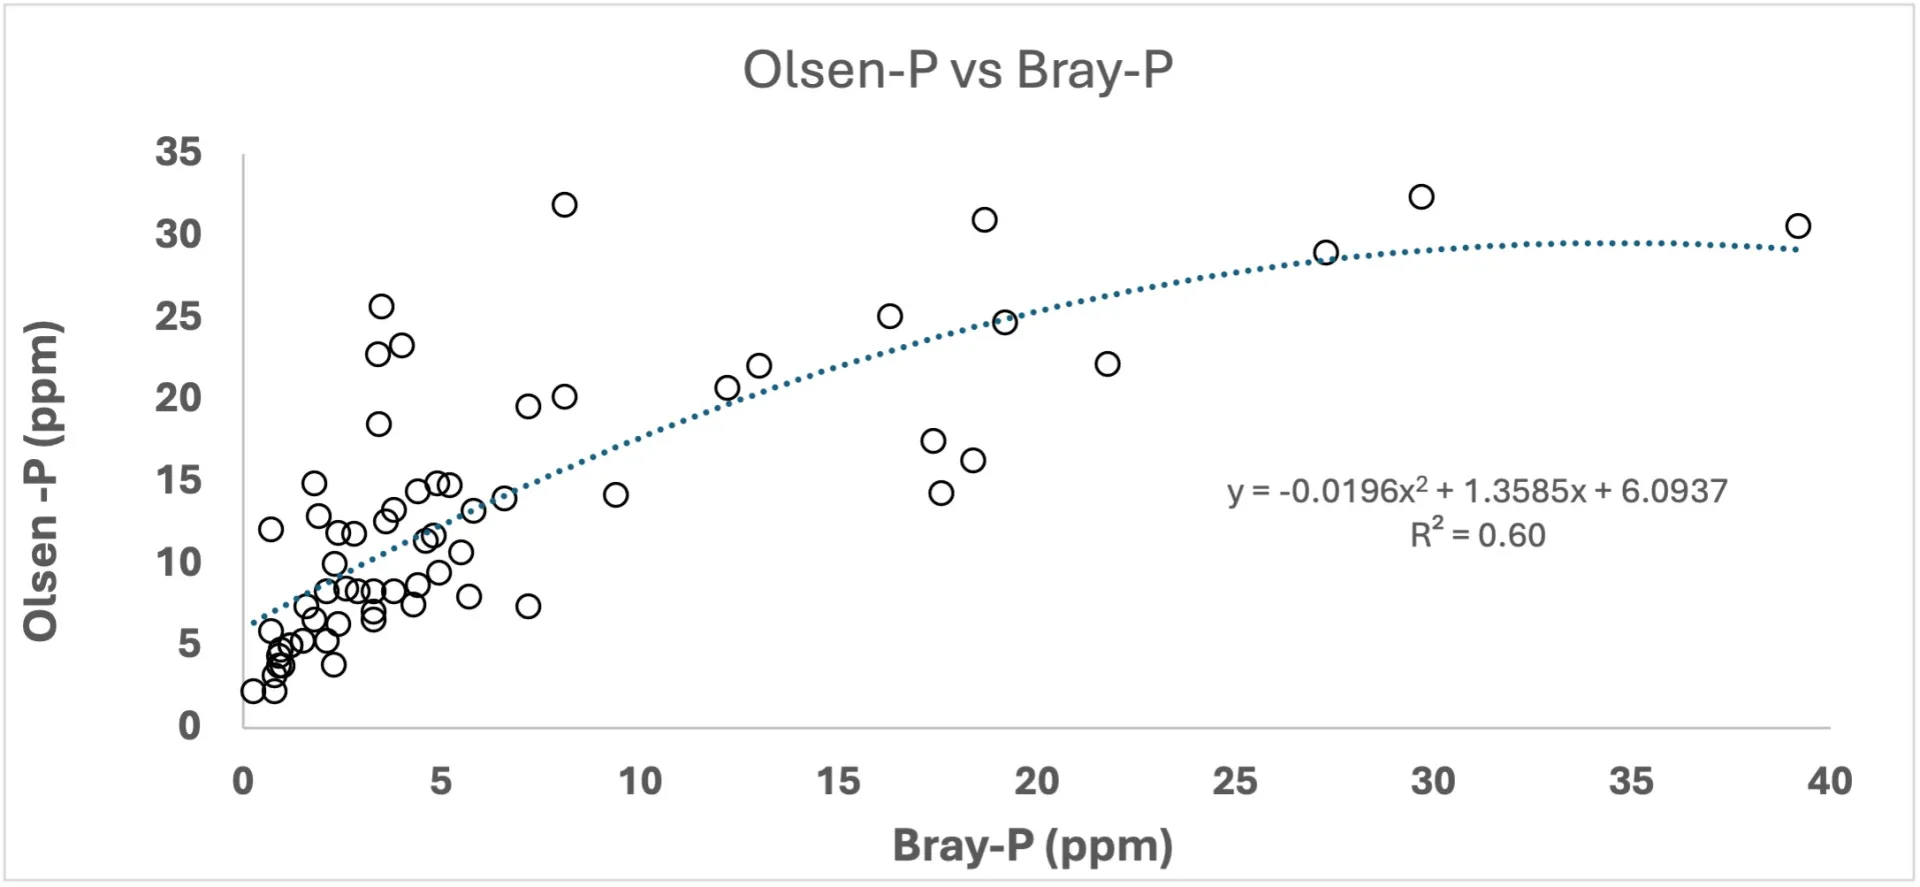
Figure 2. The correlation between Olsen-P and Bray-P.
My recommendation on using soil tests is to trust but verify. If your soil test shows adequate P levels, do not apply P at planting. Access the crop at 3-4 weeks and if the rice is a bit stunted with narrow dark green leaves, you most likely have a P deficiency. At that point you can apply a top-dress of P fertilizer. Make sure to apply the top-dress within the first month after planting.