2018 Forage Production Results for San Benito, Monterey, and Santa Cruz Counties
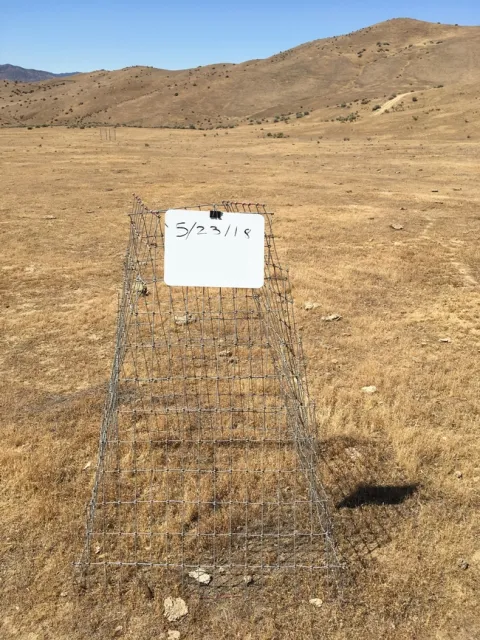
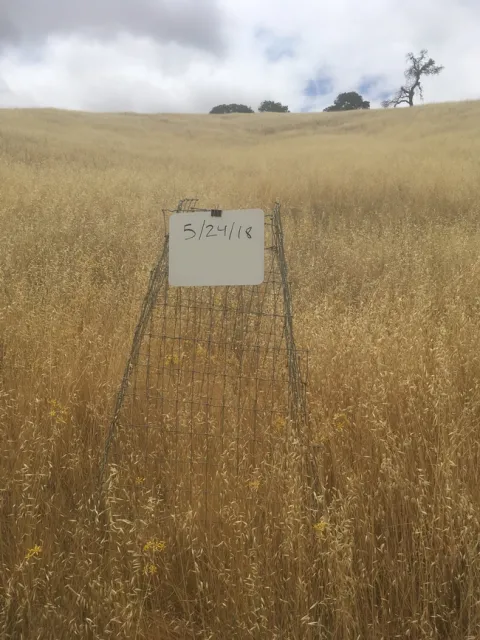
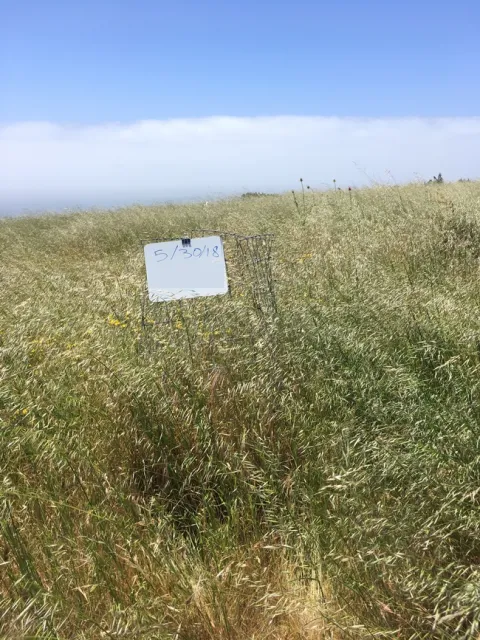
In 2018 I clipped and weighed forage production (grasses and forbs) from four ranches in San Benito County, two ranches in Monterey County, and four ranches in Santa Cruz County. The goal is to do this during peak forage production, which is when the grasses are green and seeds have developed, but before the seeds fall off (I was a little late getting to some of the sites). Peak production will usually be around mid-May. However, some areas will be at peak early in the season and some later in the season, depending on proximity to the coast, rainfall, slope, elevation, and other factors.
In this article I'll share what I found and how it compares to the Natural Resources Conservation Service's (NRCS) estimates for forage production in a normal rainfall year. The NRCS forage production data included in this article are from the Web Soil Survey. Here's the link to the Web Soil Survey, in case you want to look at the estimated forage production for your area: https://websoilsurvey.sc.egov.usda.gov/App/HomePage.htm. In this article, all forage production values are rounded to the nearest hundred.
San Benito County Forage Production
San Benito County has been divided into five rainfall zones (see Figure 1).
Figure 1. Rainfall Zones: San Benito County
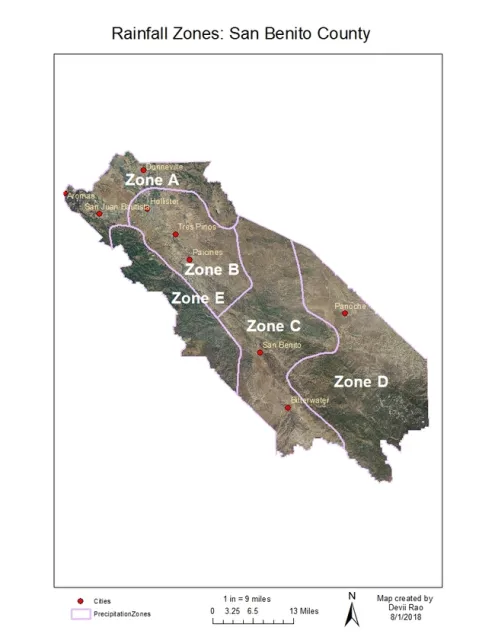
Table 1 shows three forage production values for each rainfall zone. The three forage production values are as follows:
- NRCS's estimate of forage production in a normal rainfall year. The NRCS value is considered to be the typical amount of forage that will be produced in a normal rainfall year. Therefore, this year's estimates will be compared to the NRCS estimate.
- Average forage production from 2003-2009 based on forage clipped by the previous livestock advisor. This is included in the table as an additional comparison.
- Forage production clipped this year (2018).
The last column in the table shows how different this year's production is compared to the NRCS estimate for a normal rainfall year. A plus sign before the number indicates that this year's forage production was higher than the NRCS estimate and a minus sign before the number indicates that this year's forage production was lower than the NRCS estimate.
Table 1. 2018 San Benito County Forage Production
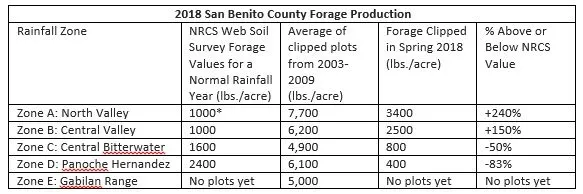
* NRCS forage production data were not available for this site, so forage production from an adjacent soil type was used.
In 2018, forage production in Zones A and B was substantially higher than the NRCS estimates (240% and 150% respectively), while forage production in Zones C and D was well below the NRCS estimates (50% and 83% respectively). The NRCS value for forage production in San Benito County Zone D (2,400 lbs/acre) is much higher than I would have expected. Zone D is in the very dry, south eastern part of the county and receives a low amount of rainfall. However, 2,400 lbs/acre is the only available published estimate so I am using it for this analysis. After collecting forage production for several years in this area, I will use my own estimate of forage production in a normal rainfall year. I do not have plots in Zone E yet, but hope to set up plots before the rainy season begins.
Monterey County Forage Production
Monterey County has been divided into five rainfall zones (see Figure 2).
Figure 2. Rainfall Zones: Monterey County
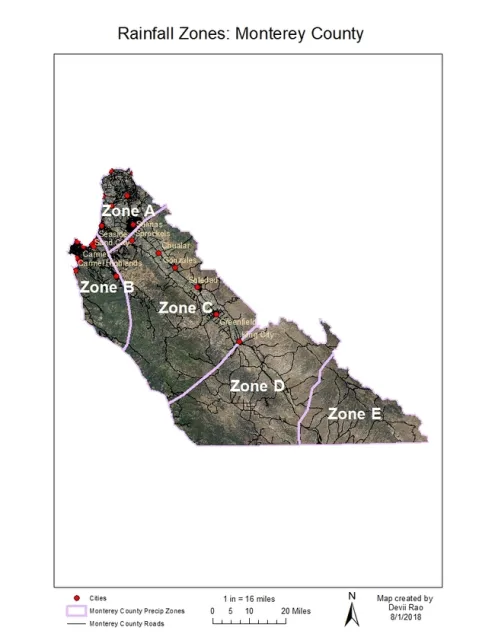
Table 2 shows two forage production values for each rainfall zone. The two forage production values are as follows:
- NRCS's estimate of forage production in a normal rainfall year. The NRCS value is considered to be the typical amount of forage that will be produced in a normal rainfall year. Therefore, this year's estimates will be compared to the NRCS estimate.
- Forage production clipped this year (2018).
The last column in the table shows how different this year's production is compared to the NRCS estimate for a normal rainfall year. A plus sign before the number indicates that this year's forage production was higher than the NRCS estimate and a minus sign before the number indicates that this year's forage production was lower than the NRCS estimate.
Table 2. 2018 Monterey County Forage Production
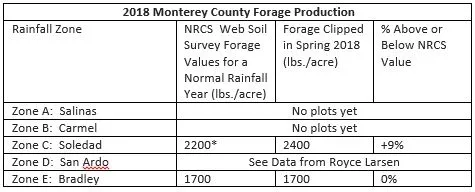
*NRCS forage production data were not available so forage production for an adjacent soil type was used.
I do not have plots in Zones A or B yet, but hope to set up plots before the rainy season begins. In 2018, forage production in Zone C was slightly above the NRCS estimate (9%). Royce Larsen, Area Natural Resource/Watershed Advisor, wrote a report which included data for Zone D. Therefore, it is not included here. Forage production in Zone E was, surprisingly, exactly the same as the NRCS estimate.
Santa Cruz County
Santa Cruz County is divided into two rainfall zones: the north coast and the southern interior part of the county. Table 3 shows two forage production values for each rainfall zone. The two forage production values are as follows:
- NRCS's estimate of forage production in a normal rainfall year. The NRCS value is considered to be the typical amount of forage that will be produced in a normal rainfall year. Therefore, this year's estimates will be compared to the NRCS estimate.
- Forage production clipped this year (2018).
The last column in the table shows how different this year's production is compared to the NRCS estimate for a normal rainfall year. A plus sign before the number indicates that this year's forage production was higher than the NRCS estimate and a minus sign before the number indicates that this year's forage production was lower than the NRCS estimate.
Table 3. 2018 Santa Cruz County Forage Production
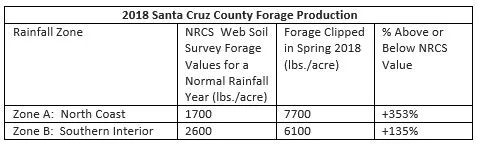
In 2018 forage production in both rainfall zones, the north coast and southern interior areas of the county, were substantially higher than the NRCS estimate (353% and 135% respectively).
Rainfall
Rainfall is an important driver of forage production (Becchetti et al. 2016). A year with normal rainfall may have lower than normal forage production if most of the rain falls early in the season when temperatures are low. On the other hand, a low rainfall year may produce higher than normal amounts of forage if the rain falls later in the season when temperatures are higher.
Table 4 shows two rainfall estimates for Santa Cruz, San Benito, and Monterey counties. One column for each county shows data from a Remote Automatic Weather Stations (RAWS) weather station (https://raws.dri.edu/) and the other column shows data from a California Irrigation Management Information System (CIMIS) weather station (https://cimis.water.ca.gov/). The last row shows average annual rainfall for each weather station. There are various limitations and inaccuracies in the both rainfall datasets (e.g. days when data were not collected due to malfunctioning weather station), but they are still useful to see major differences between months and locations.
Table 4. Rainfall October 2017 – June 2018
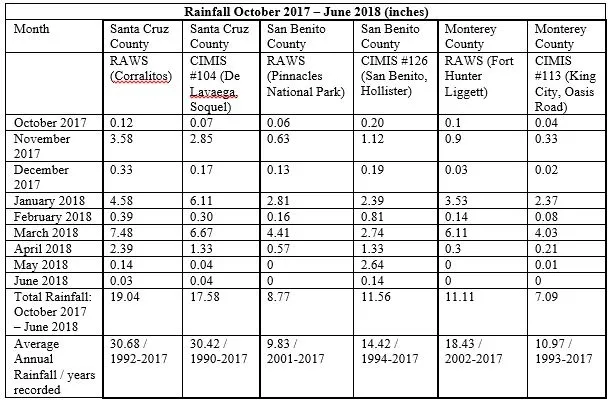
We had a slow start to the year with very little rain in October, slightly more in November, very little in December and then a bump in January. Much of the rain came late in the season, in March, and forage increased considerably during that time. In general, livestock did not have much to eat during the fall and winter, but then late-winter/early-spring came with a lot of forage growth and in some cases more growth than the cattle could keep up with. However, San Benito County Zone D was certainly an exception with very little growth this year.
References Cited
Becchetti, T.; George, M.; McDougald, N.; Dudley, D.; Connor, M.; Vaughn, C.; Forero, L.; Frost, W.; Larsen, R.; Davy, J.; Striby, K.; Doran, M.; Marrkegard, G. (2016) Rangeland Management Series: Annual Range Forage Production. University of California, Agriculture and Natural Resoruces ANR 8018, 1-13.